Creating dashboards
Dashboards bring your metrics and logs onto one canvas. This guide walks through creating a dashboard, adding panels, arranging them, and sharing the result. It takes about ten minutes.
Step 1. Open Dashboards
From the Observability area, open Dashboards. You will see the dashboards you already have, each as a card with its panel count and the date it was last updated.
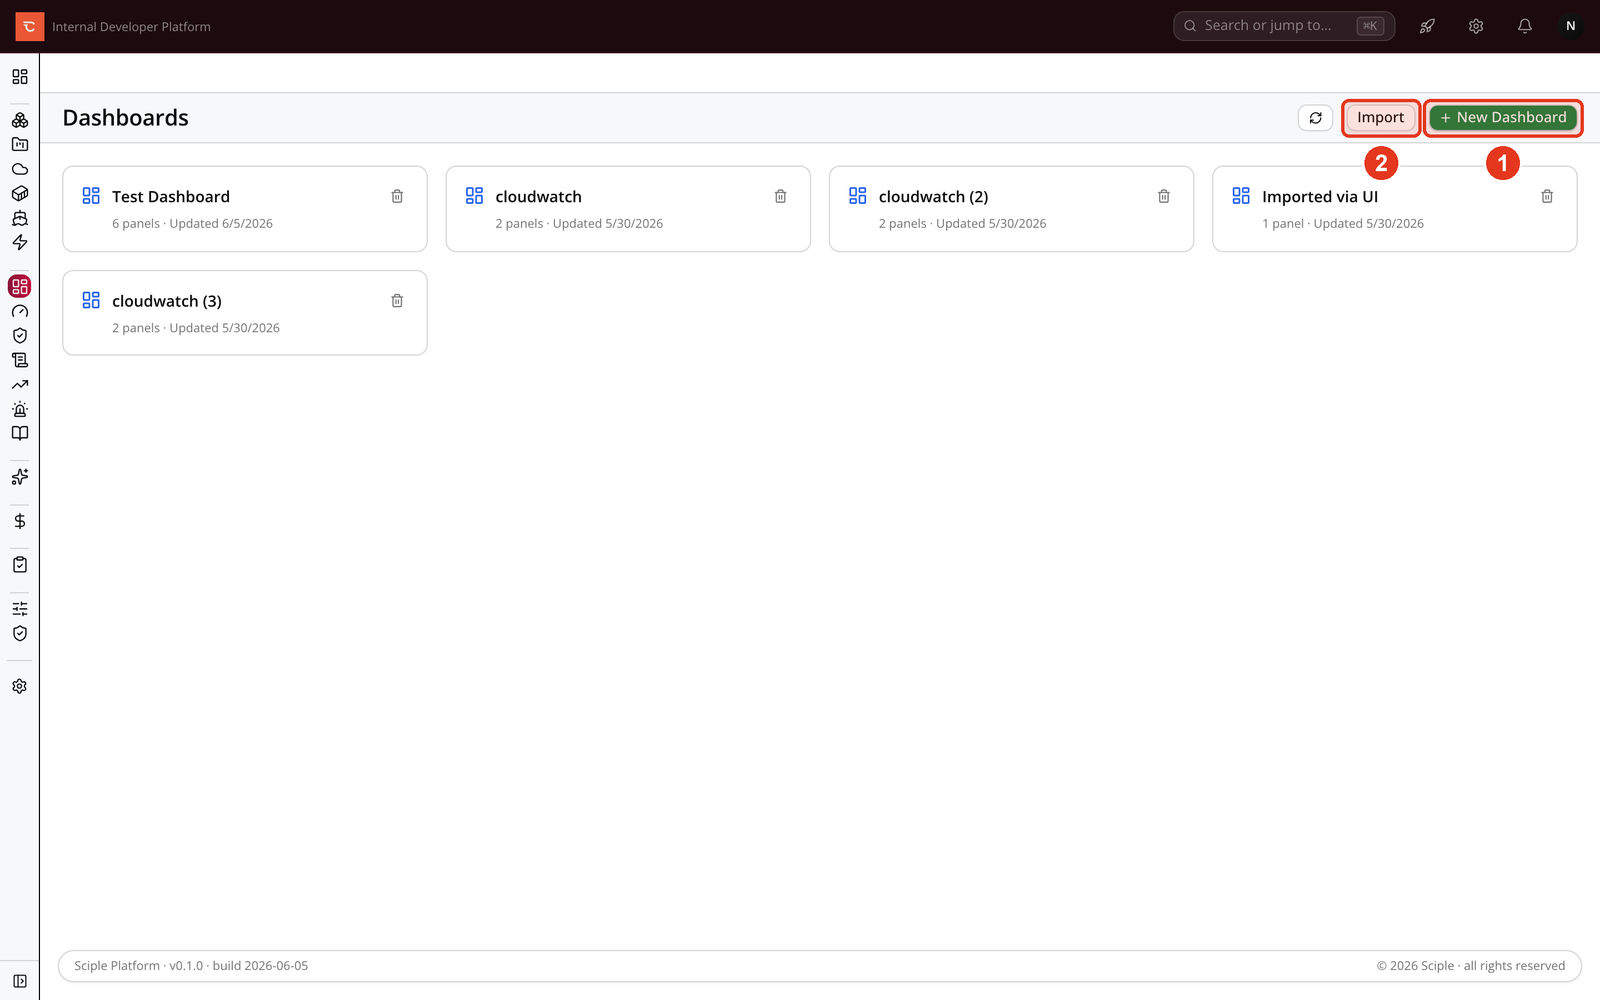
- 1 Create a dashboard from scratch with New Dashboard.
- 2 Bring one in from a file with Import, which is useful for moving a dashboard between environments.
Step 2. Name the dashboard
Give the dashboard a name, and optionally a short description so teammates know what it is for. You can change both later.
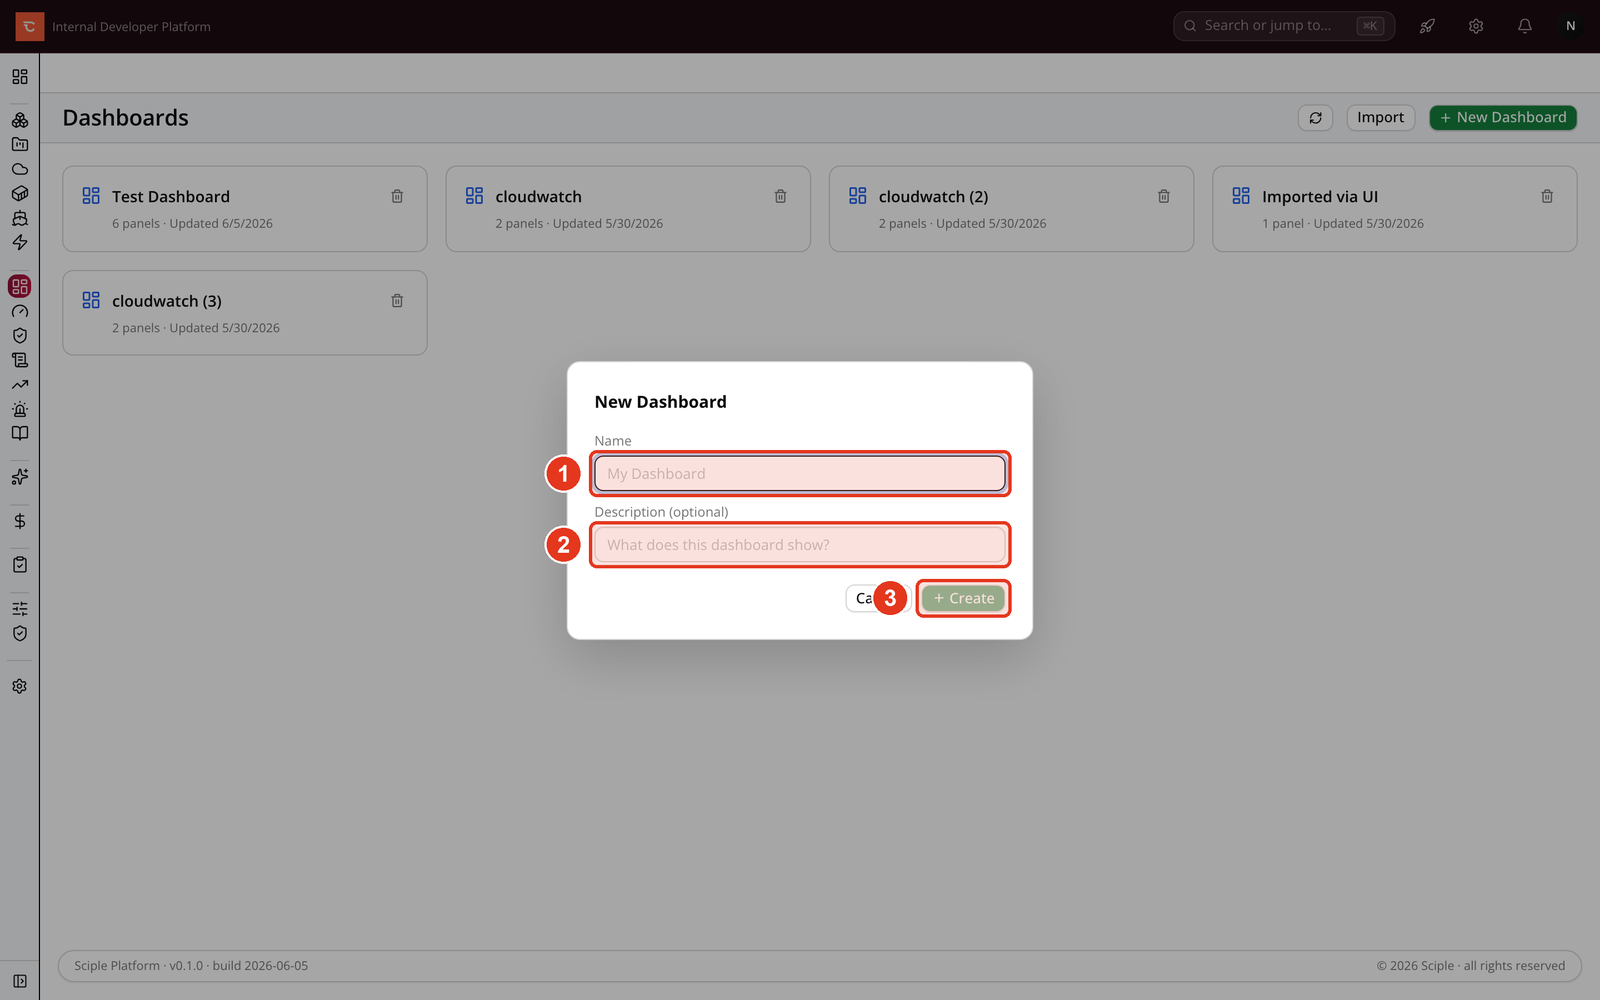
- 1 Enter a Name.
- 2 Add an optional Description.
- 3 Click Create. You land on the empty dashboard, ready for panels.
Step 3. Enter edit mode and add a panel
A new dashboard starts empty. Switch into edit mode to add panels and rearrange the layout. In edit mode the grid becomes draggable and each panel gains its own edit, duplicate, and delete controls.
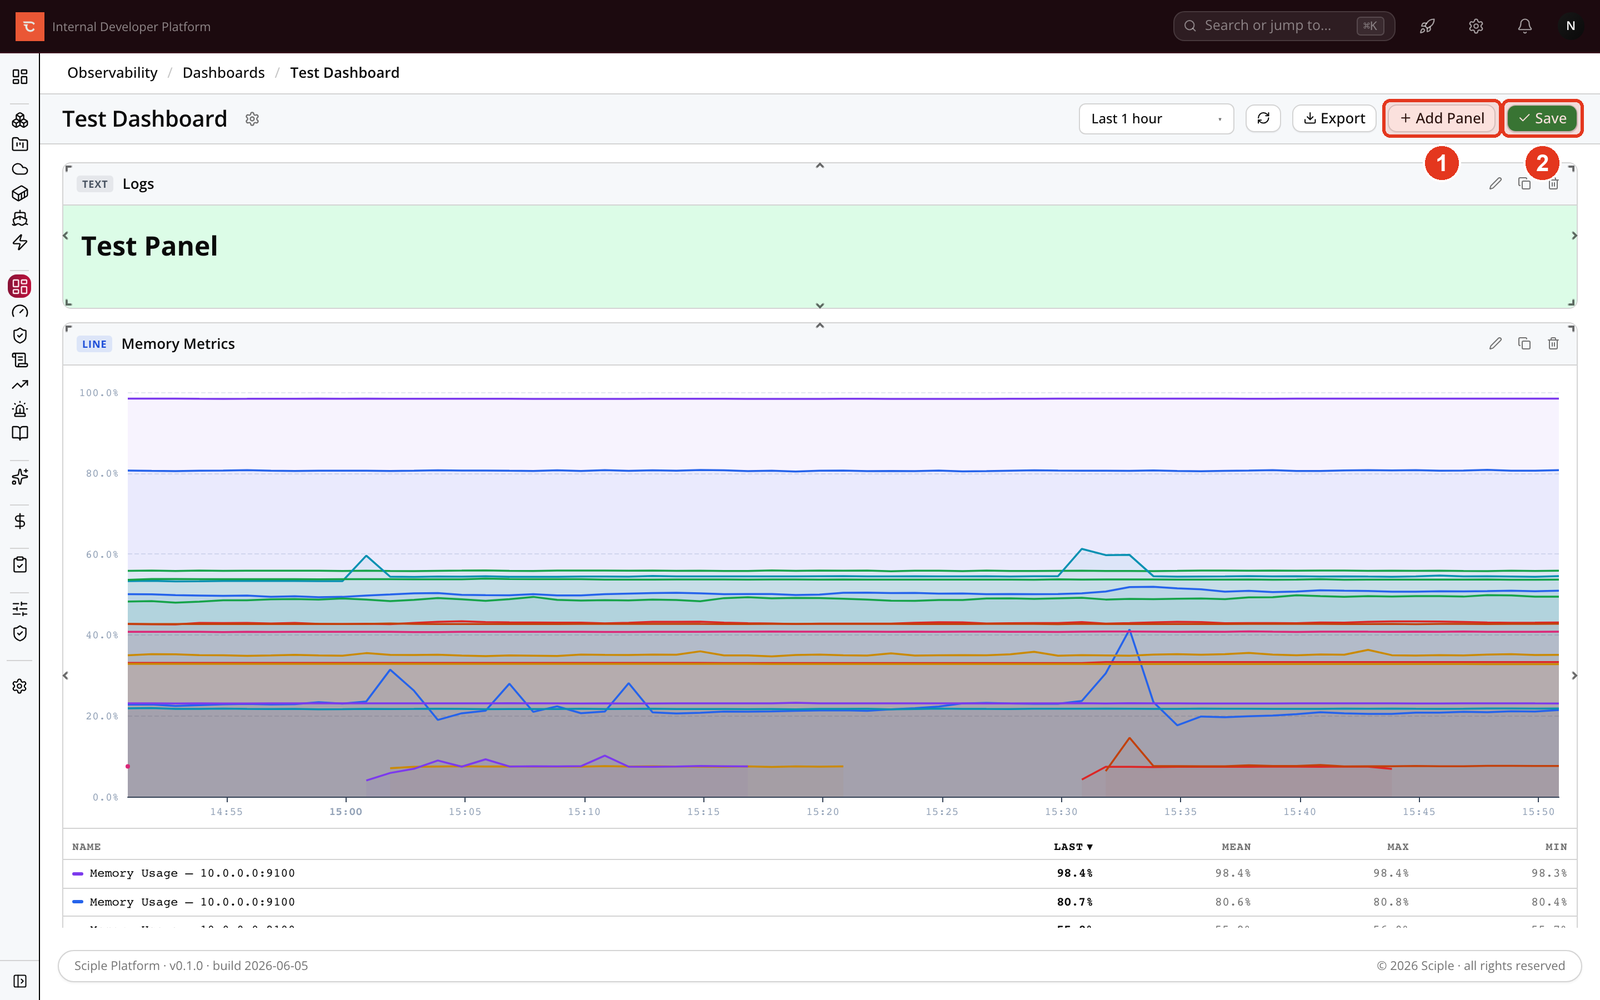
- 1 Click Add Panel to open the panel editor.
- 2 When you are done, Save exits edit mode and stores the layout.
Step 4. Configure the panel
Each panel pulls from one of three categories. Metric panels draw charts from Prometheus or CloudWatch as a line, bar, stat, or gauge. Log panels show a raw or aggregated log table from your log sources. Text panels hold a heading or note and fetch no data, which is handy for labelling sections of a busy board.
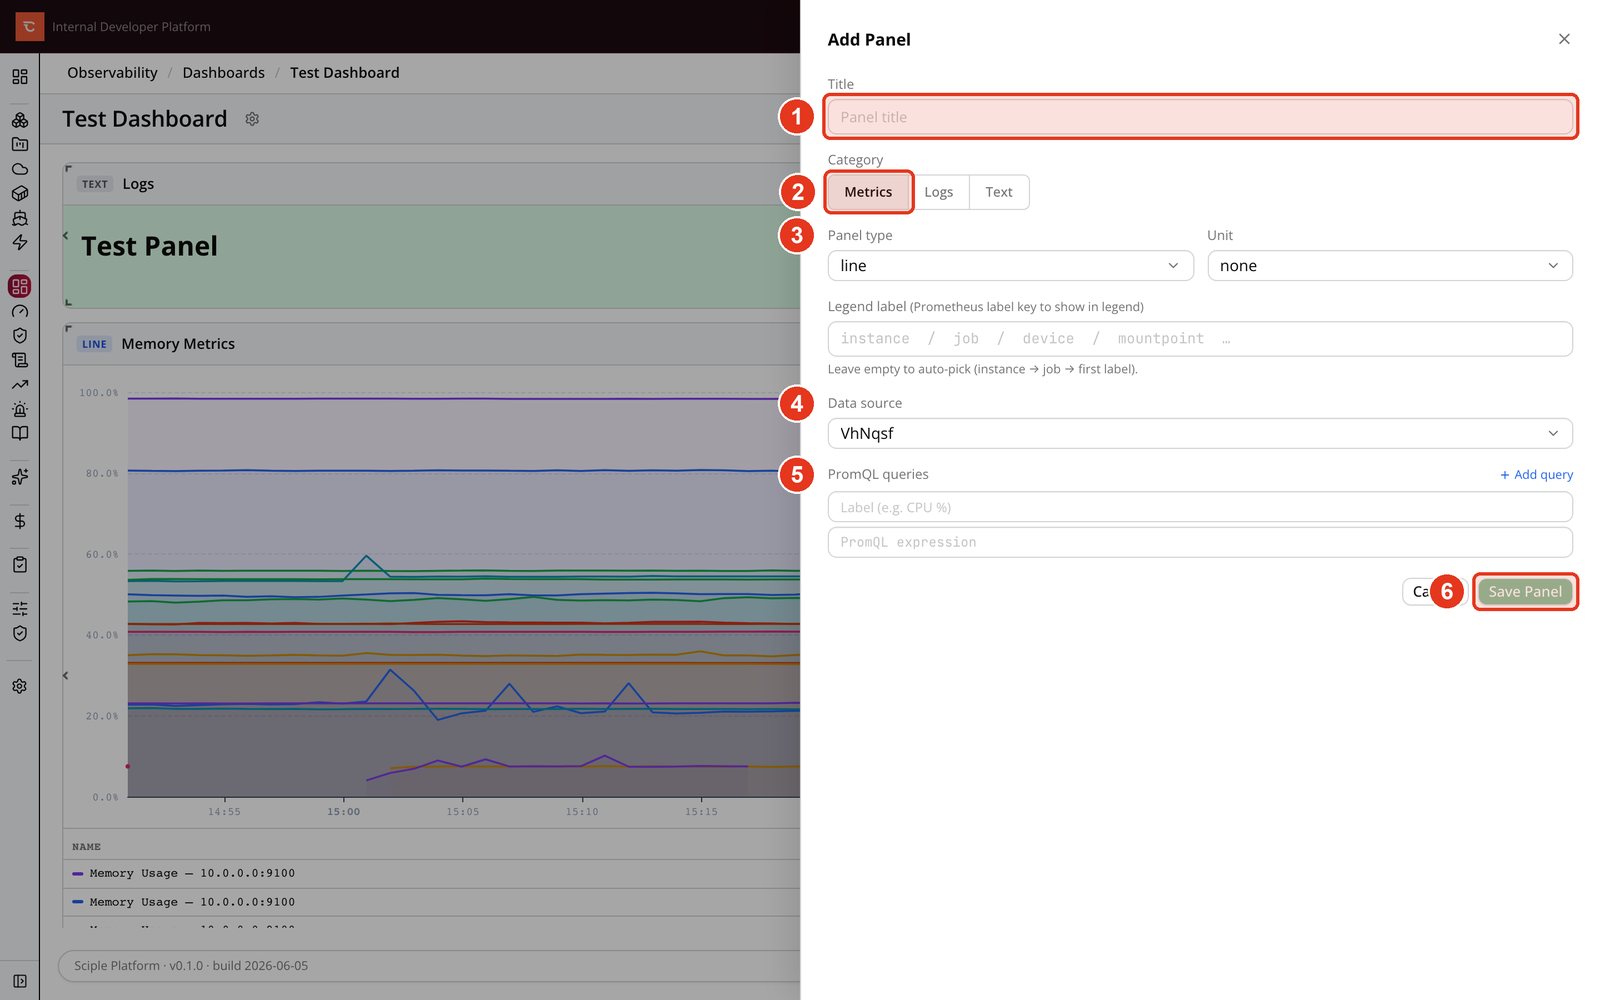
- 1 Give the panel a Title.
- 2 Pick a Category of Metric, Log, or Text.
- 3 Choose the Panel type (line, bar, stat, gauge, and so on).
- 4 Select the Data source to read from.
- 5 Write one or more queries, adding a label to each so the legend stays readable.
- 6 Save Panel to drop it onto the grid.
Step 5. Arrange and save
Back on the grid, drag panels to reposition them and pull a panel’s edge to resize it. The layout uses a twelve-column grid, so panels snap into tidy rows. When the board looks right, click Save to leave edit mode.
The finished dashboard is read-only by default, so a casual viewer can’t move things by accident. Use the time-range control to change the window every panel covers, and Export to download the dashboard as a file you can import elsewhere.
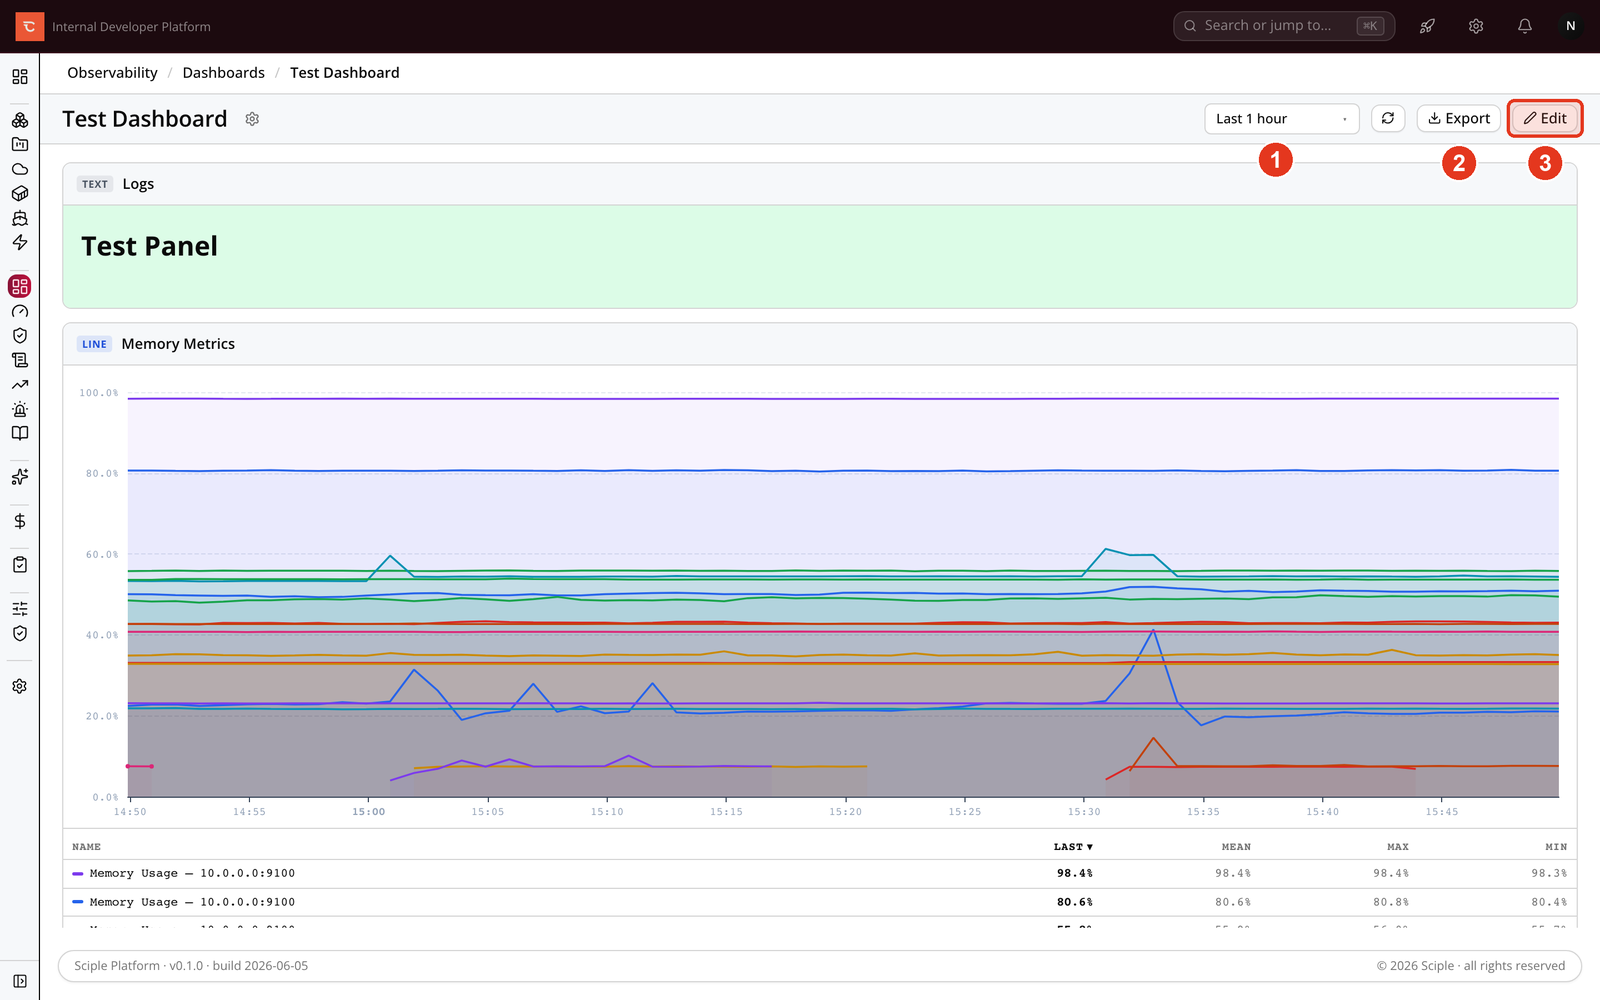
- 1 Set the time range shared by every panel.
- 2 Export the dashboard to a file.
- 3 Re-enter Edit at any time to change panels or layout.
Sharing and permissions
Open Dashboard Settings from the gear beside the title to rename the dashboard or manage who can see it. Access is granted per user with one of three roles: a Viewer can open the dashboard, an Editor can add and edit panels, and an Admin can manage permissions and delete the dashboard.
What is next
- Monitoring & Metrics Explorer covers the queries behind metric panels.
- Logging covers the sources behind log panels.
- Incidents & alerts brings your alarms and alert rules together.