Connecting data sources
Observability reads from your own backends, so connecting them is the first thing to do. Before you can explore metrics, logs, or traces, or build a dashboard, you tell Sciple which providers your tenant uses and how to reach each one. You do this once, and every other observability screen picks the connections up automatically.
Where data sources live
Open Manage → Observability. The area is split into three tabs that match the three pillars: Logging, Monitoring, and Tracing. Each tab pairs the providers for that pillar with their connections, so you configure everything for one pillar in one place. CloudWatch appears under both Logging and Monitoring because one CloudWatch connection serves both.
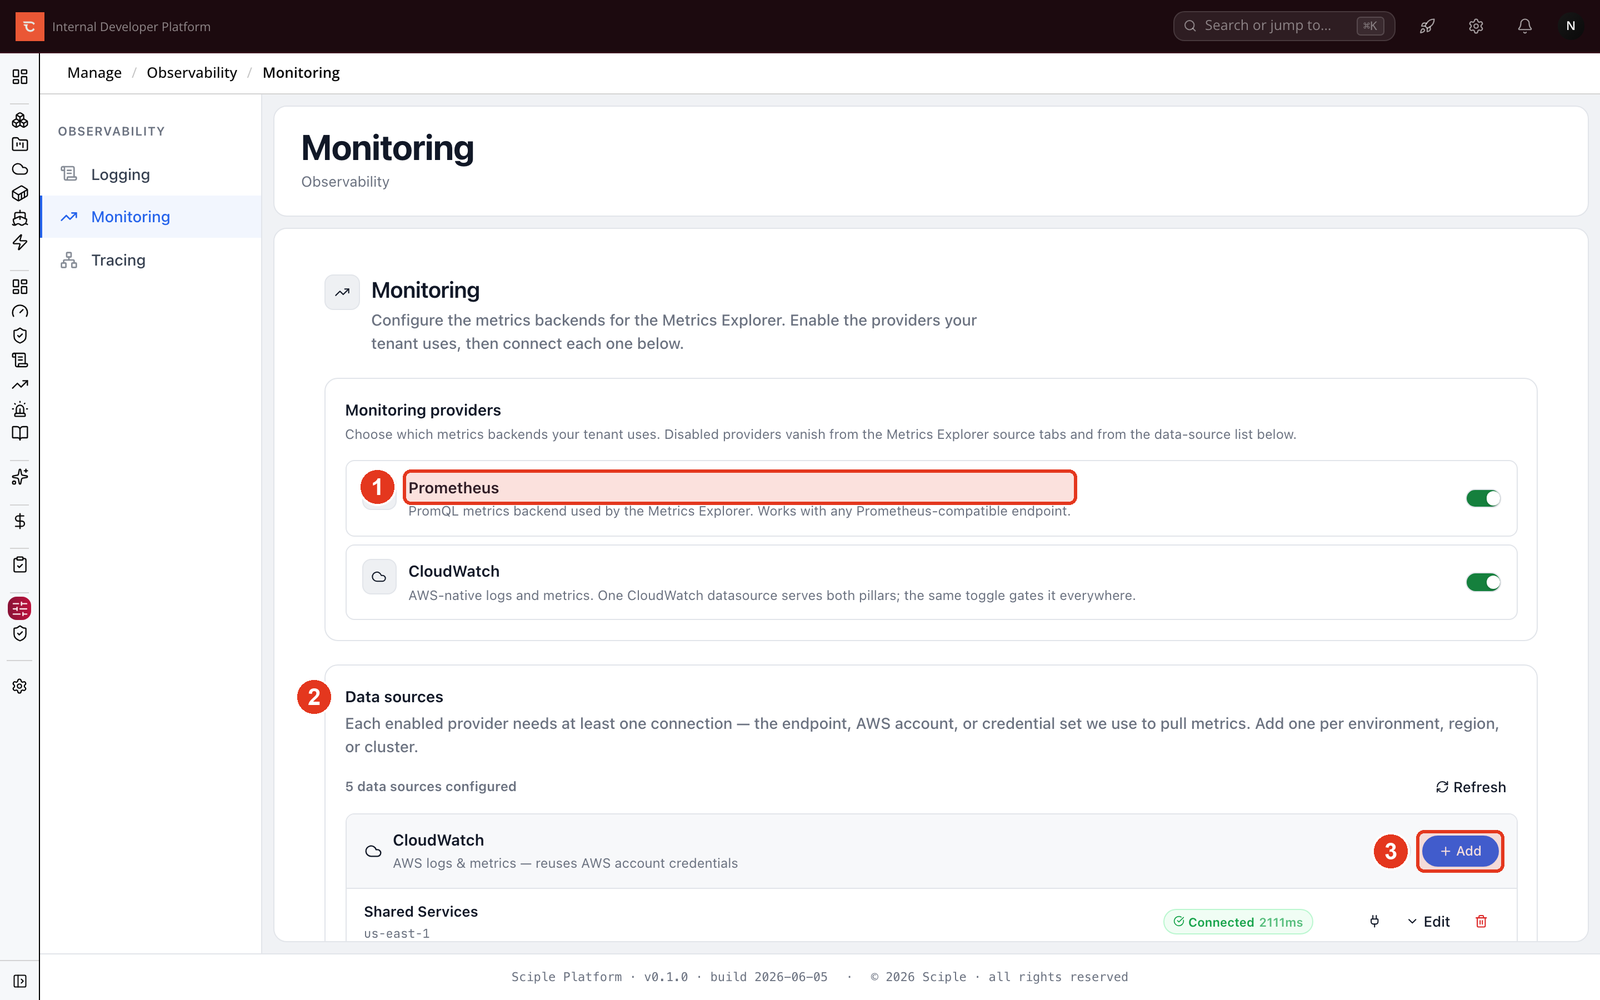
- 1 Turn on the providers your tenant uses.
- 2 Add a connection for each one under Data sources.
- 3 Use Add to create a new connection.
Step 1. Enable the providers you use
Each tab lists the providers it supports, and you switch on the ones your tenant runs. A disabled provider drops out of the explorer source tabs and the data source list, so the interface only ever shows backends you actually use. The supported providers are Elasticsearch or OpenSearch, CloudWatch, and Athena for logs; Prometheus and CloudWatch for metrics; and Jaeger for traces.
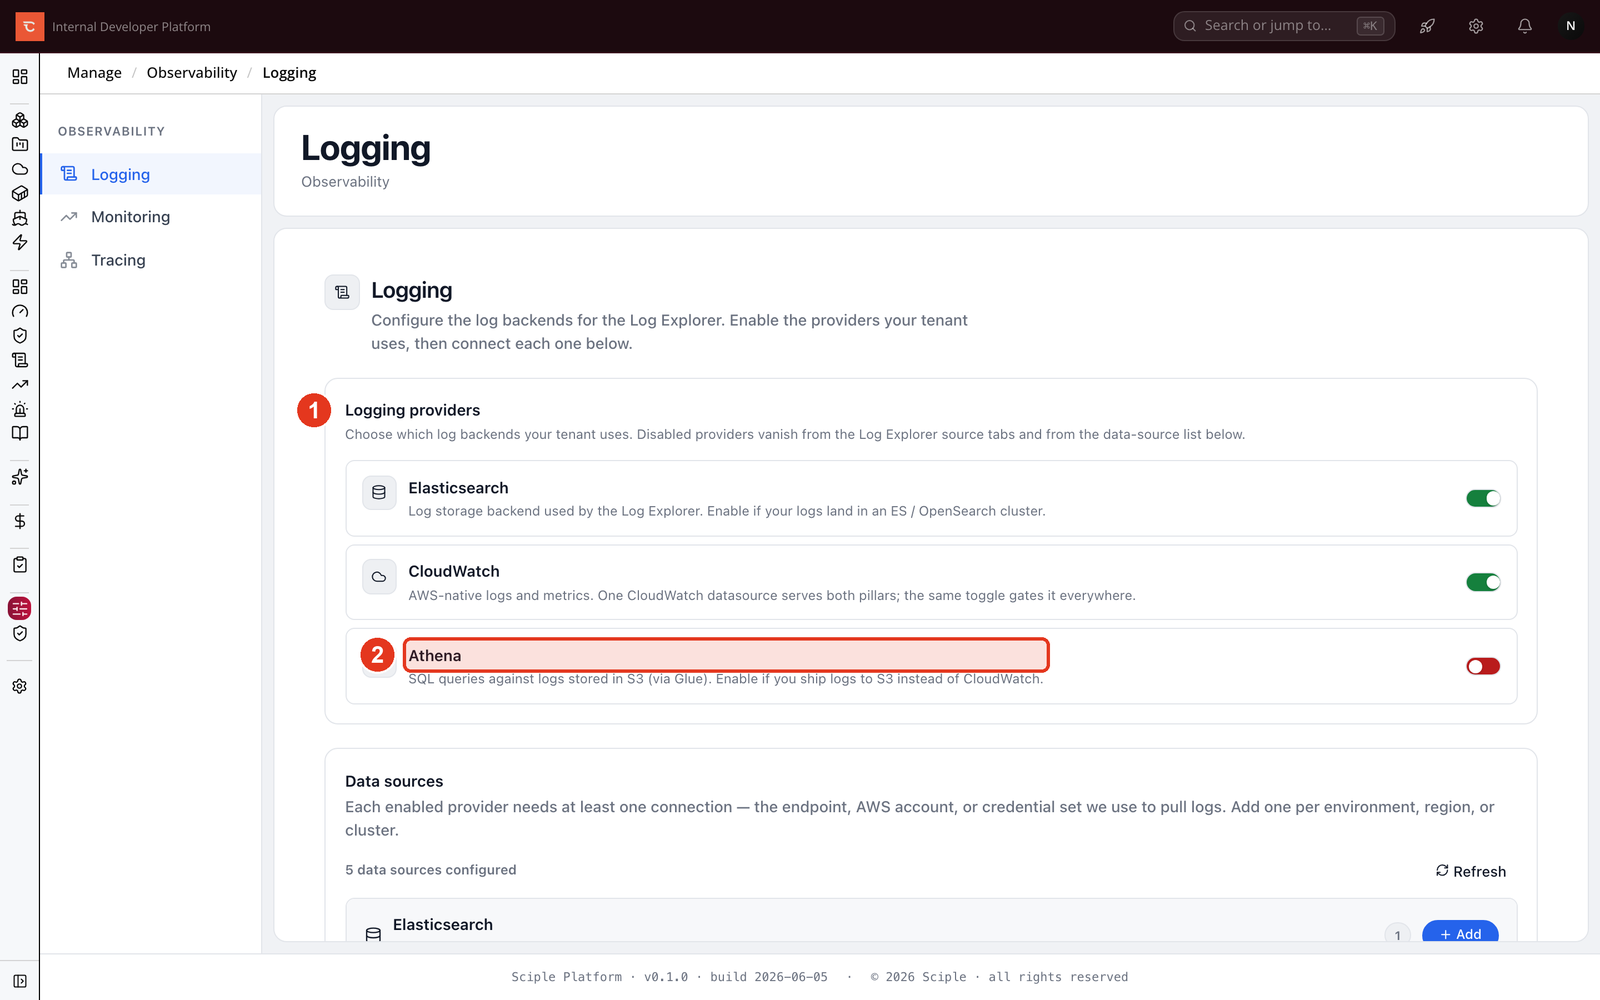
- 1 The providers available for this pillar.
- 2 A provider you do not use stays switched off, like Athena here.
Step 2. Add a connection
A provider needs at least one connection before it returns data. Click Add next to a provider and fill in the connection details. What you enter depends on the provider: Prometheus and Elasticsearch take an endpoint URL, while CloudWatch and Athena reuse one of your connected AWS accounts and a region, so there is no separate credential to manage. Give each connection a clear name, since you can add several per provider, one for each environment, region, or cluster.
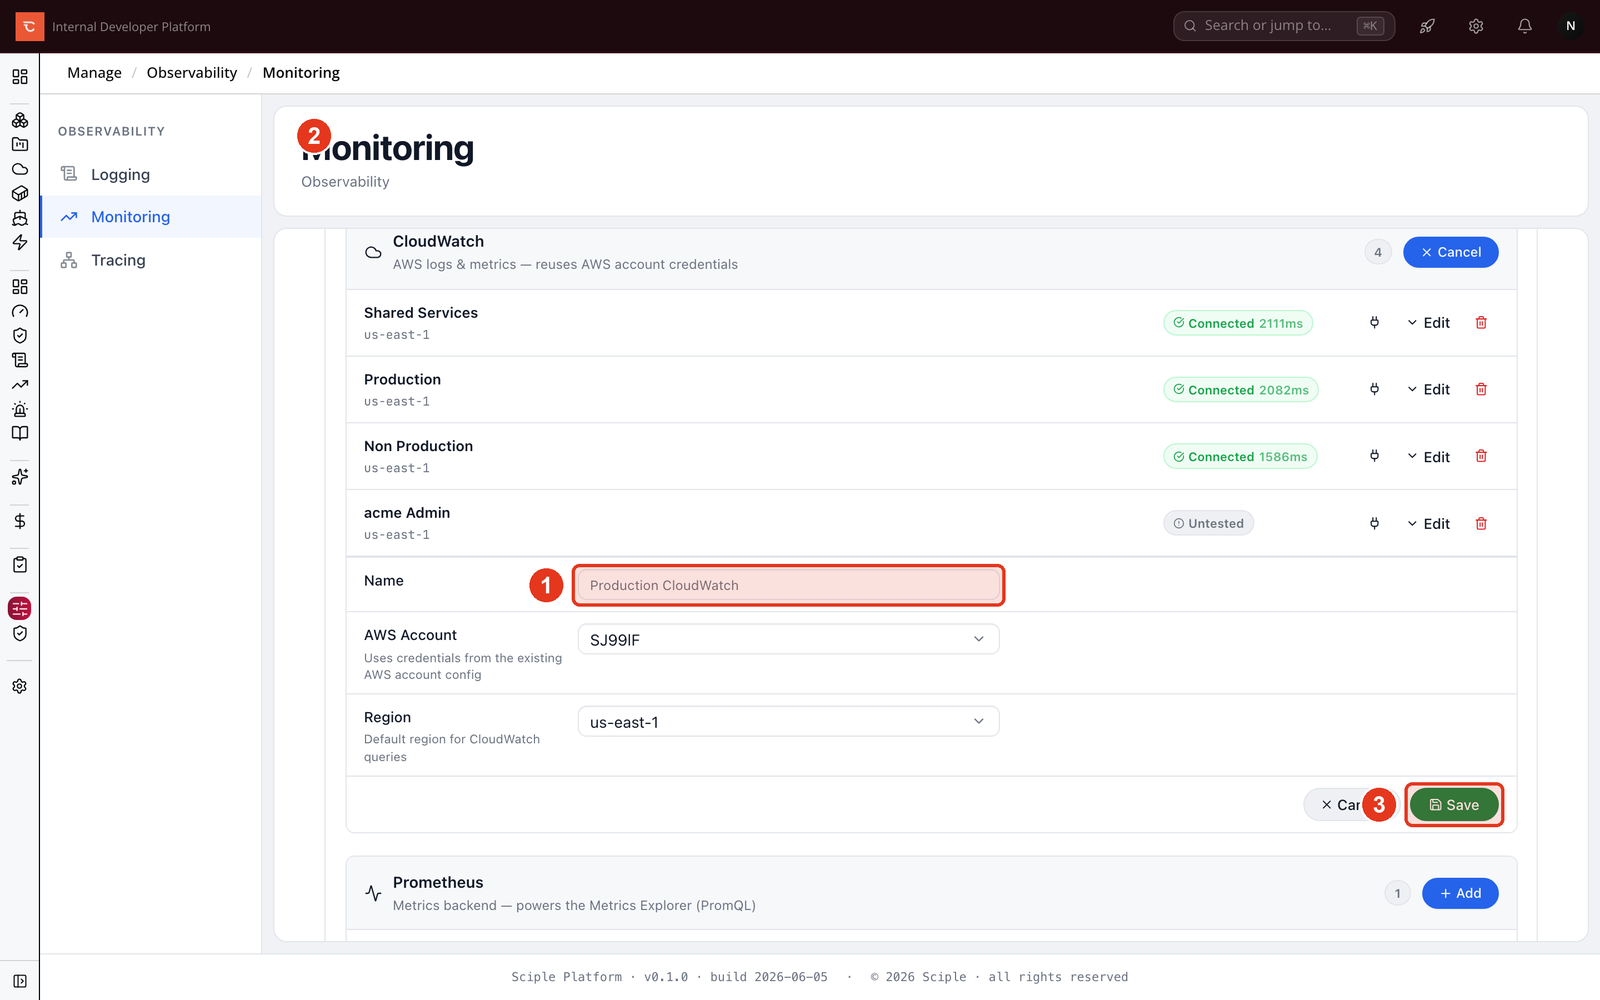
- 1 Give the connection a Name.
- 2 Point it at an endpoint, or pick an AWS account and region for CloudWatch and Athena.
- 3 Save the connection.
Once saved, a connection shows a Connected badge with its response time when Sciple can reach it. Use Test to check a connection at any time, and Edit or delete it as your setup changes.
What is next
With your sources connected, every observability screen can read from them. Build a board in Creating dashboards, query metrics and logs, follow requests in Tracing, or track Incidents & alerts.