Logging
The log explorer searches your logs across backends and shows them in one consistent table. Pick a source, filter to what you care about, choose which fields appear as columns, and page through the results, or follow new lines as they arrive.
Searching Elasticsearch & OpenSearch
Choose an index pattern, then filter with a simple query. The field list on the left shows every field discovered in the data; tick the ones you want as columns and they appear in the table immediately. Results are paged, and the time range at the top bounds the search.
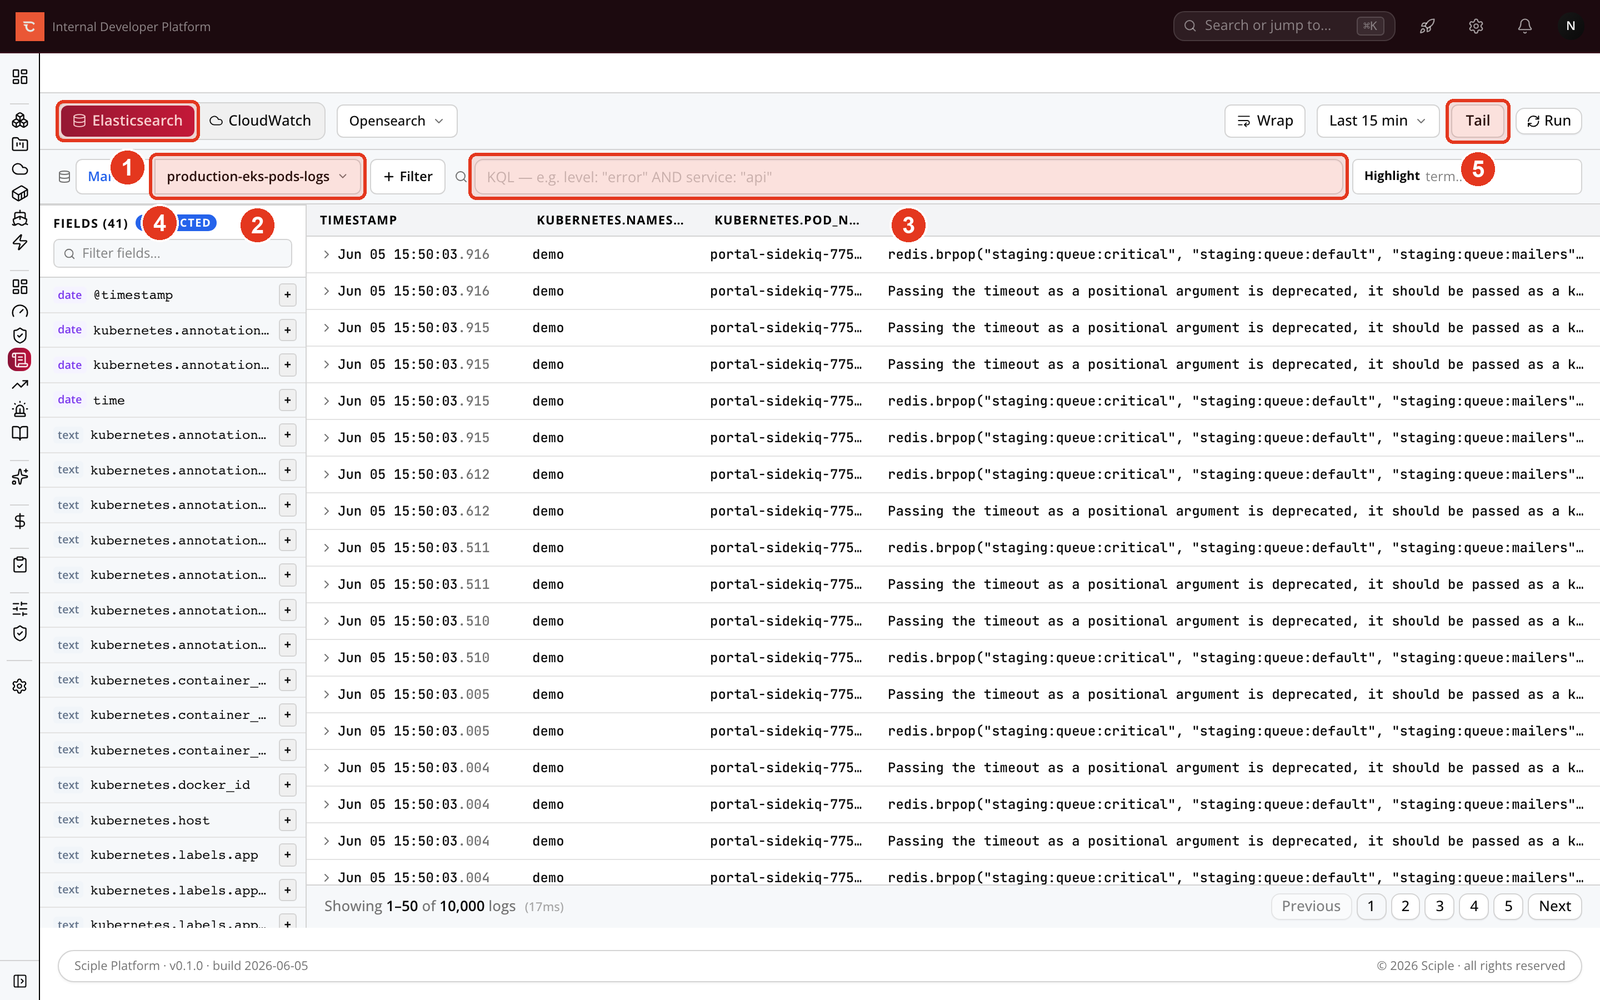
- 1 Pick the source, either Elasticsearch or CloudWatch.
- 2 Choose an index pattern.
- 3 Type a filter to narrow the results.
- 4 Tick fields to add them as columns.
- 5 Use Tail to follow new lines live (see below).
Searching CloudWatch Logs
On the CloudWatch tab, choose the AWS data source and a log group, then add a filter pattern. As with Elasticsearch, the field panel lets you shape the columns. Save a log group and filter combination as a view so you can come back to it in one click.
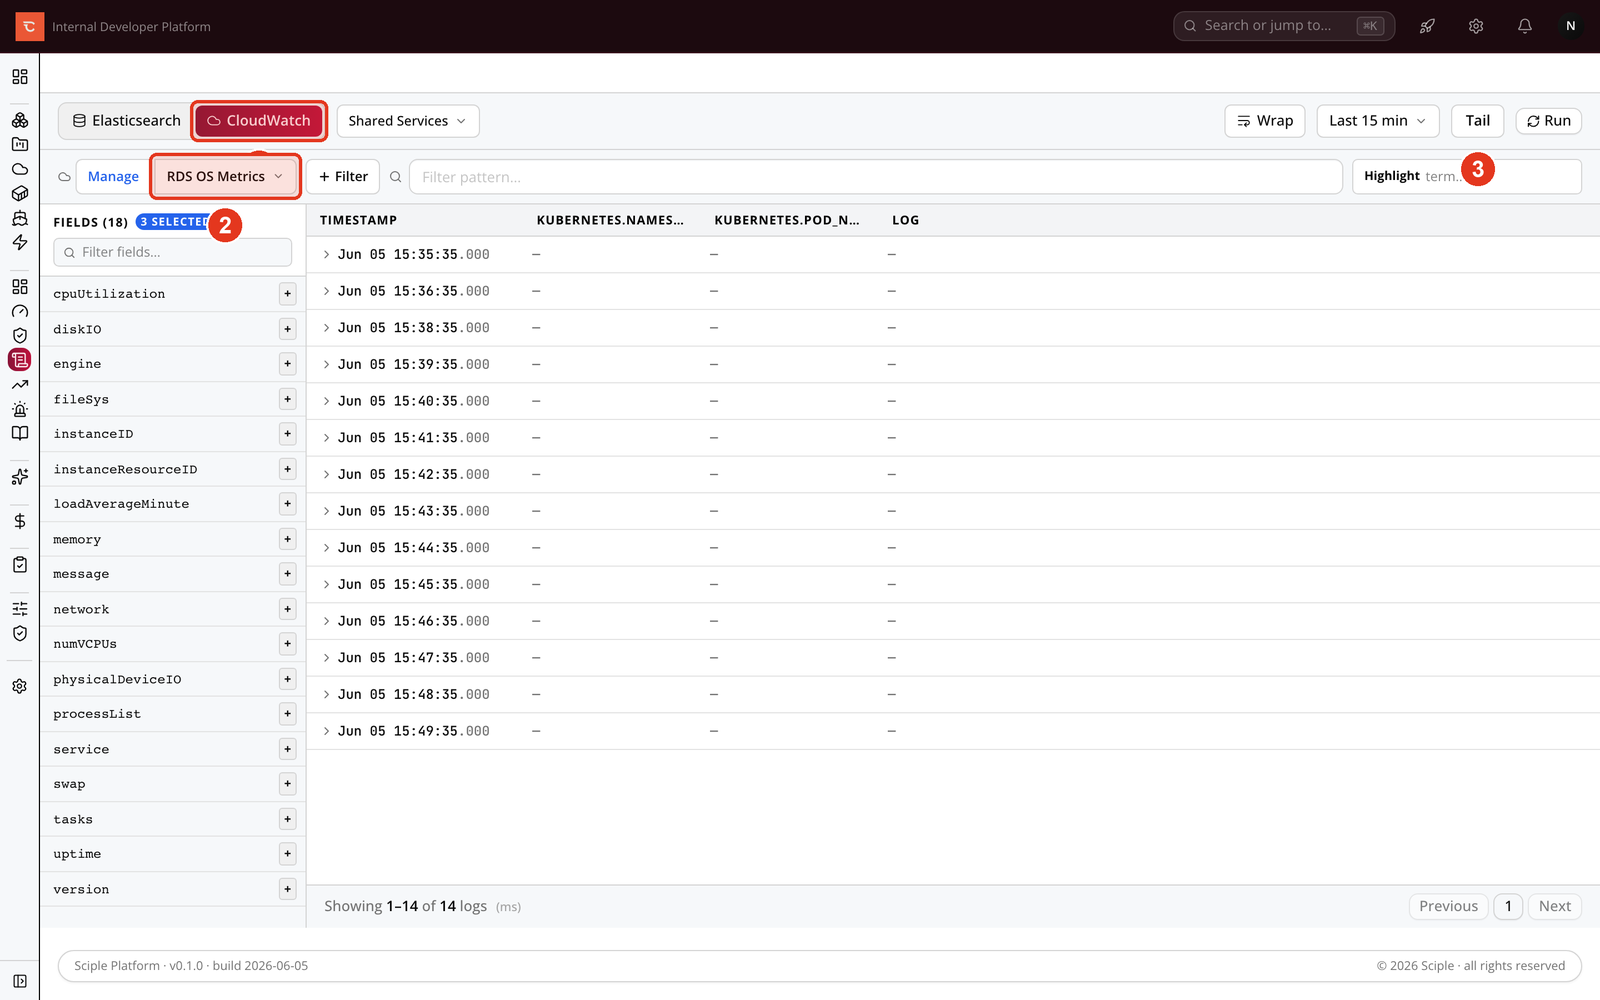
- 1 Switch to the CloudWatch source.
- 2 Pick a log group to search.
- 3 Tail streams matching lines as they are written.
Following logs live
Tail streams new lines into the table as they are written, so you can watch a deploy or reproduce an issue in real time. Stop the stream at any point and the lines you captured stay on screen. Level badges for debug, info, warn, error, and fatal make the severity of each line easy to scan, and you can expand any row to see its full set of fields.
Managing index patterns and default columns
The Manage button in the explorer toolbar is where you set up index patterns and decide which fields the table shows by default. On the Elasticsearch tab it opens the index patterns screen. Saved patterns sit in the left rail, and selecting one opens its editor on the right.
A pattern needs a name, the index pattern itself, such as logs-*, and a time
field. The most useful part is Default columns: the fields you pin here are
the columns the Log Explorer surfaces the moment the pattern is opened, in the order you set.
If you are not sure what a pattern contains, Scan indices reads the
cluster’s mappings live, lists every discovered field, and lets you tick the ones to pin.
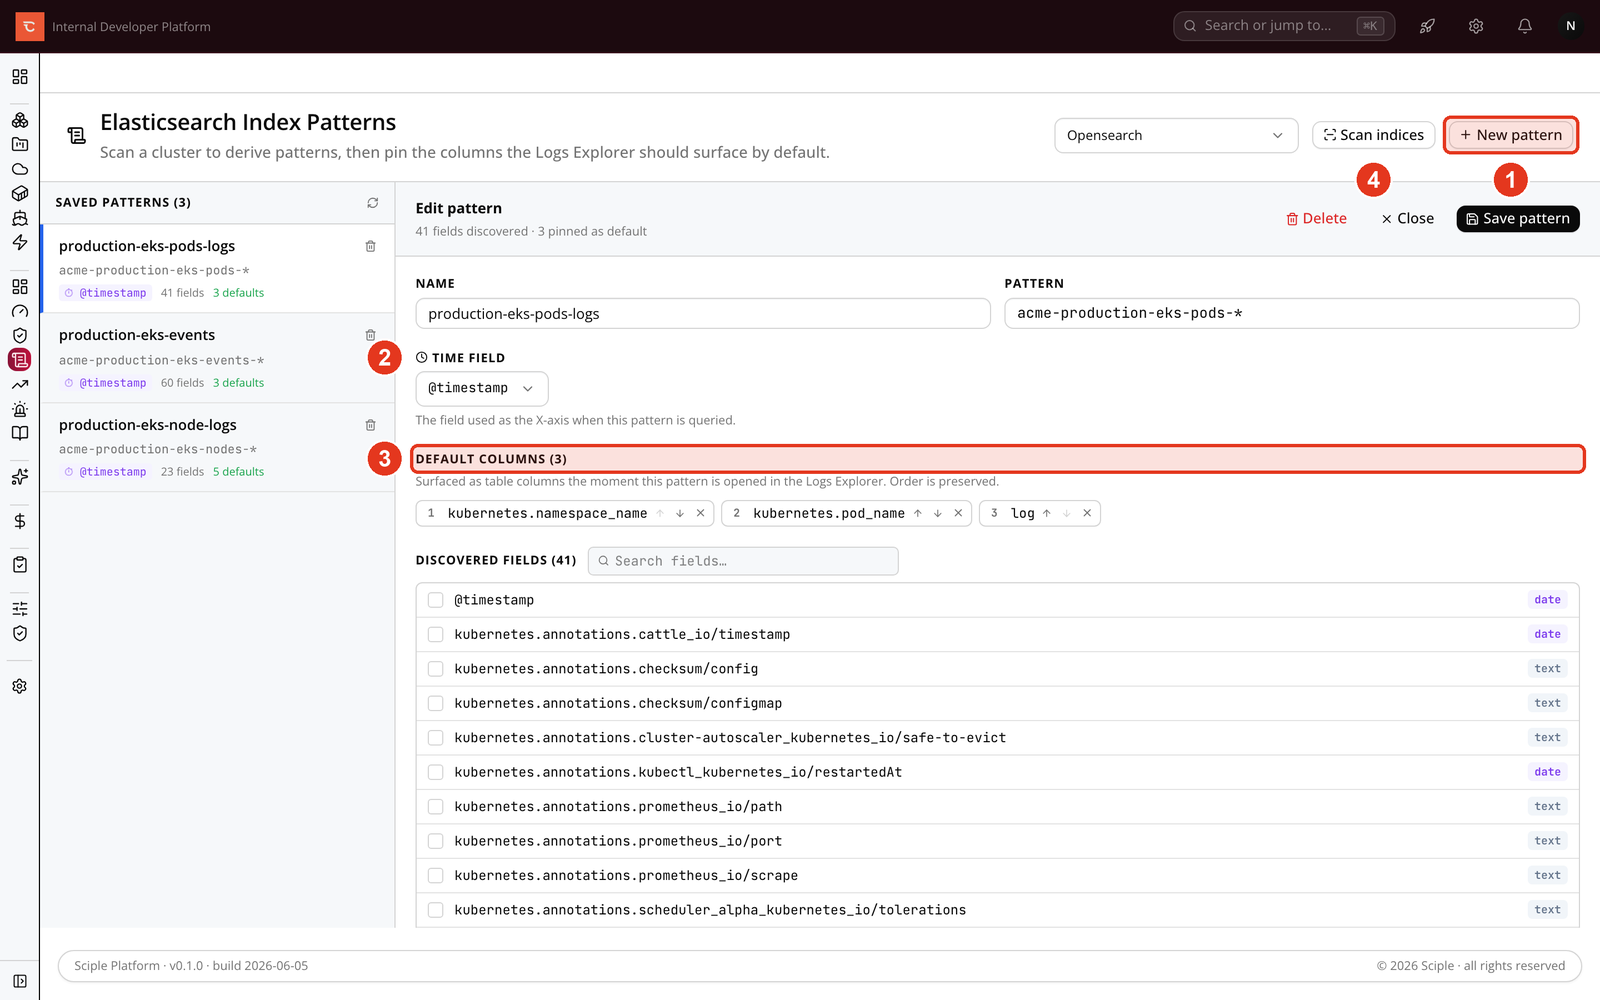
- 1 Create a pattern with New pattern, or pick one from the left rail.
- 2 Set the Time field used to order results.
- 3 Pin and reorder the Default columns the table shows.
- 4 Scan indices to discover fields, then tick the ones to pin.
The CloudWatch tab has its own Manage button for saved views. A view stores a log group together with a filter and a default set of fields, so a setup you return to often is one click away.
Related
- Monitoring & Metrics Explorer for the numeric side of the picture.
- Tracing to follow a single request across services.