Monitoring & Metrics Explorer
The metrics explorer is where you query and chart time-series data. It speaks to two backends, Prometheus and Amazon CloudWatch, and presents both through the same chart, so you can investigate from one place.
Querying Prometheus
On the Prometheus tab, write a PromQL expression and run it. Pick the time window and the sampling step to control how much detail the chart shows, then read the series in the chart and the summary table below it.
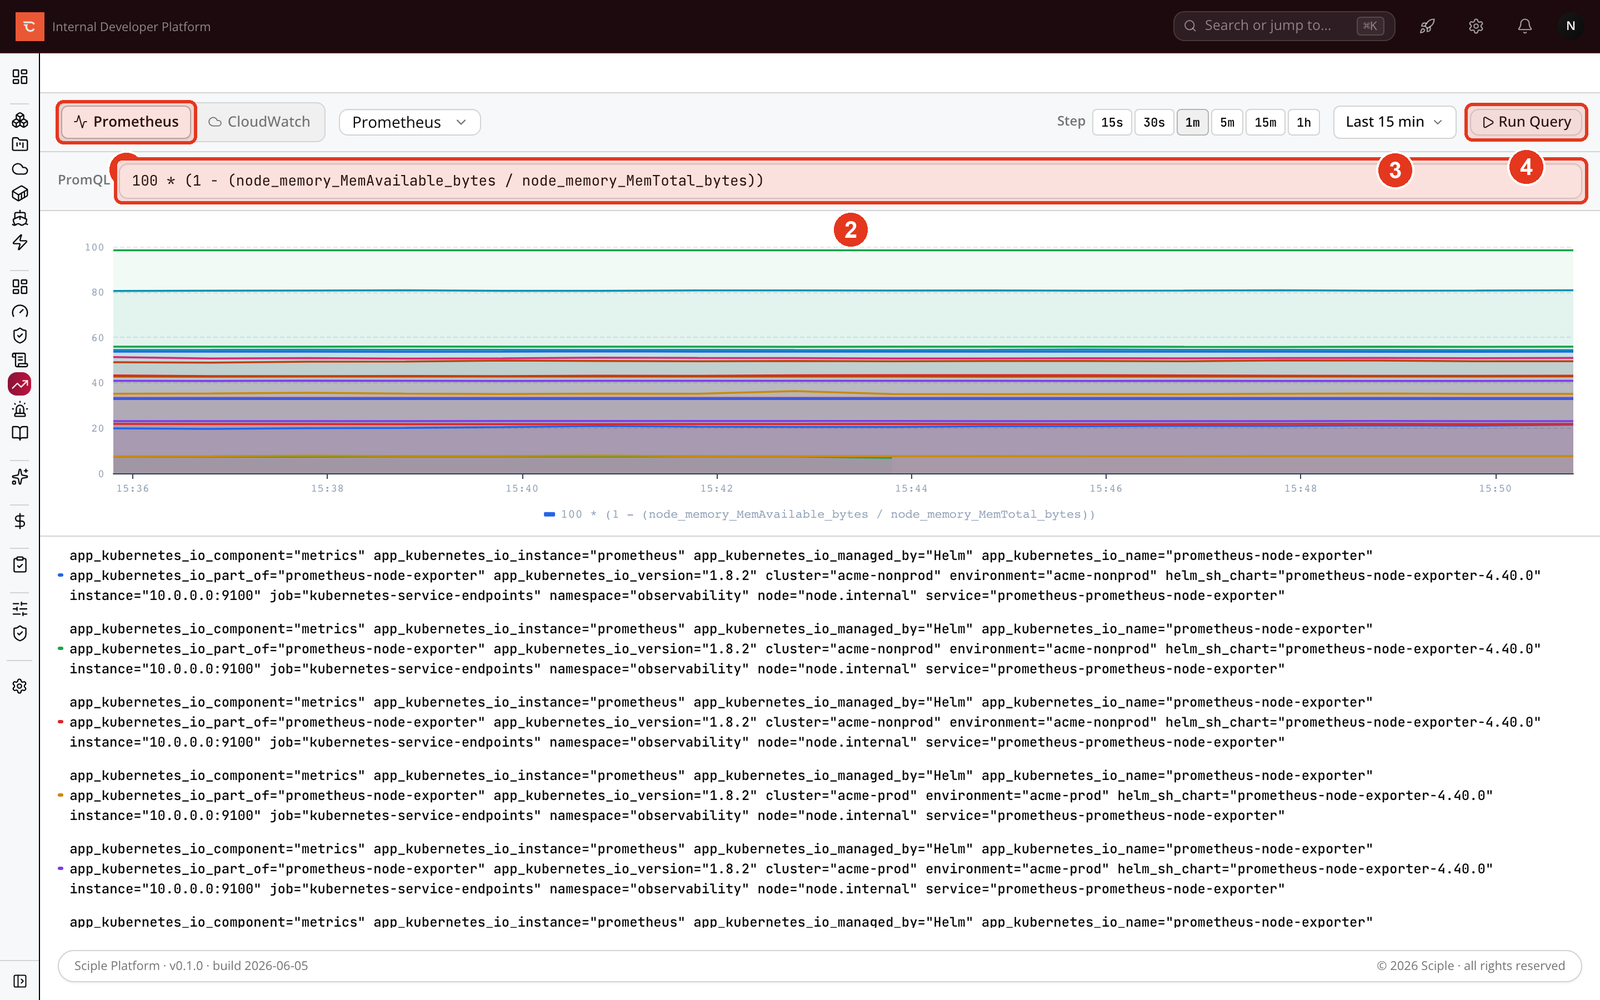
- 1 Switch between Prometheus and CloudWatch.
- 2 Enter a PromQL expression.
- 3 Choose the time range and step.
- 4 Click Run Query, and each matching series is drawn as its own line, with the latest, mean, max, and min summarised underneath.
Querying CloudWatch
The CloudWatch tab builds a query without you writing any expression. Choose the AWS data source, then pick a namespace, a metric within it, and a statistic. Add dimensions to narrow the result to a specific resource. The metric catalogue loads from the connected account, so you only see metrics that actually exist.
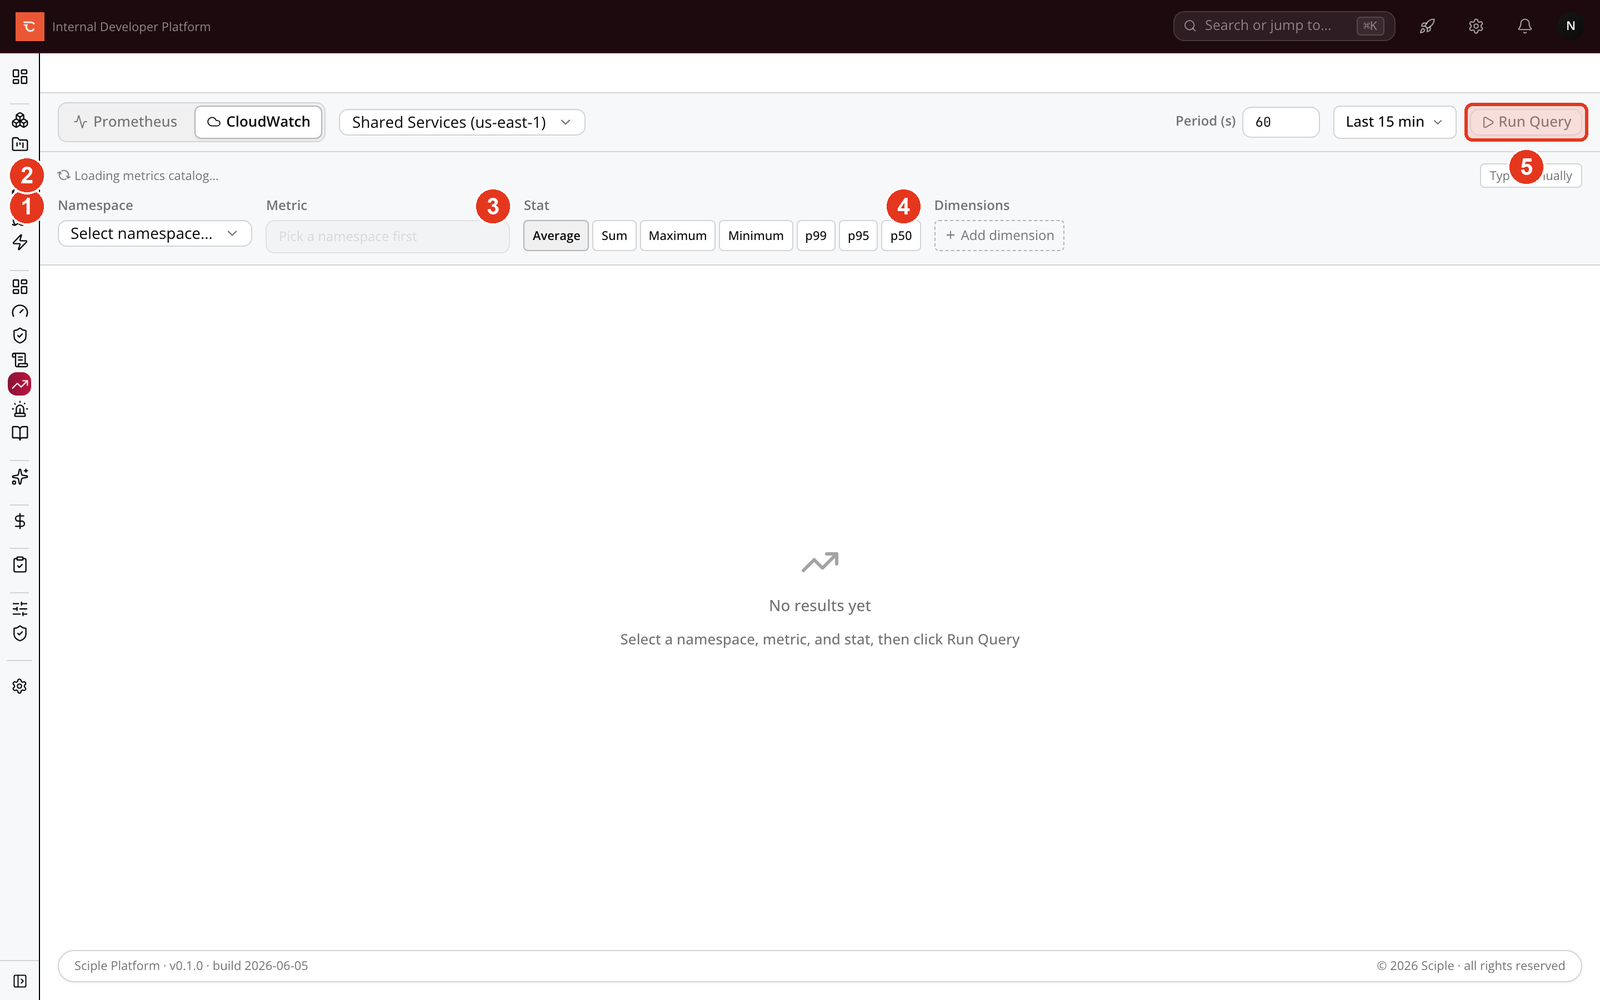
- 1 Pick a Namespace (for example AWS/EC2 or AWS/RDS).
- 2 Choose a Metric from that namespace.
- 3 Select a Statistic such as Average, Sum, Maximum, Minimum, or a percentile.
- 4 Add Dimensions to target a specific resource.
- 5 Click Run Query to chart the result.
Reading the chart
Every series is coloured and labelled so overlapping lines stay legible. The window you pick at the top applies to the whole chart; widen it to spot trends, narrow it to inspect a spike. The step controls resolution, so a smaller step shows more points but takes longer to query over long windows.
Related
- Incidents & alerts surfaces the alarms and alert rules built on these metrics.
- Creating dashboards pins your best queries onto a shared board.