Incidents & alerts
The incidents view gathers active CloudWatch alarms and Prometheus alert rules from every connected data source into one screen, so you can see what is firing right now without hopping between consoles.
All incidents
The default view combines both kinds of signal. The cards along the top summarise the overall picture, showing how many are active versus healthy, the total count, and how many data sources are reporting. Switch between Active and All to focus on what is firing or to review everything.
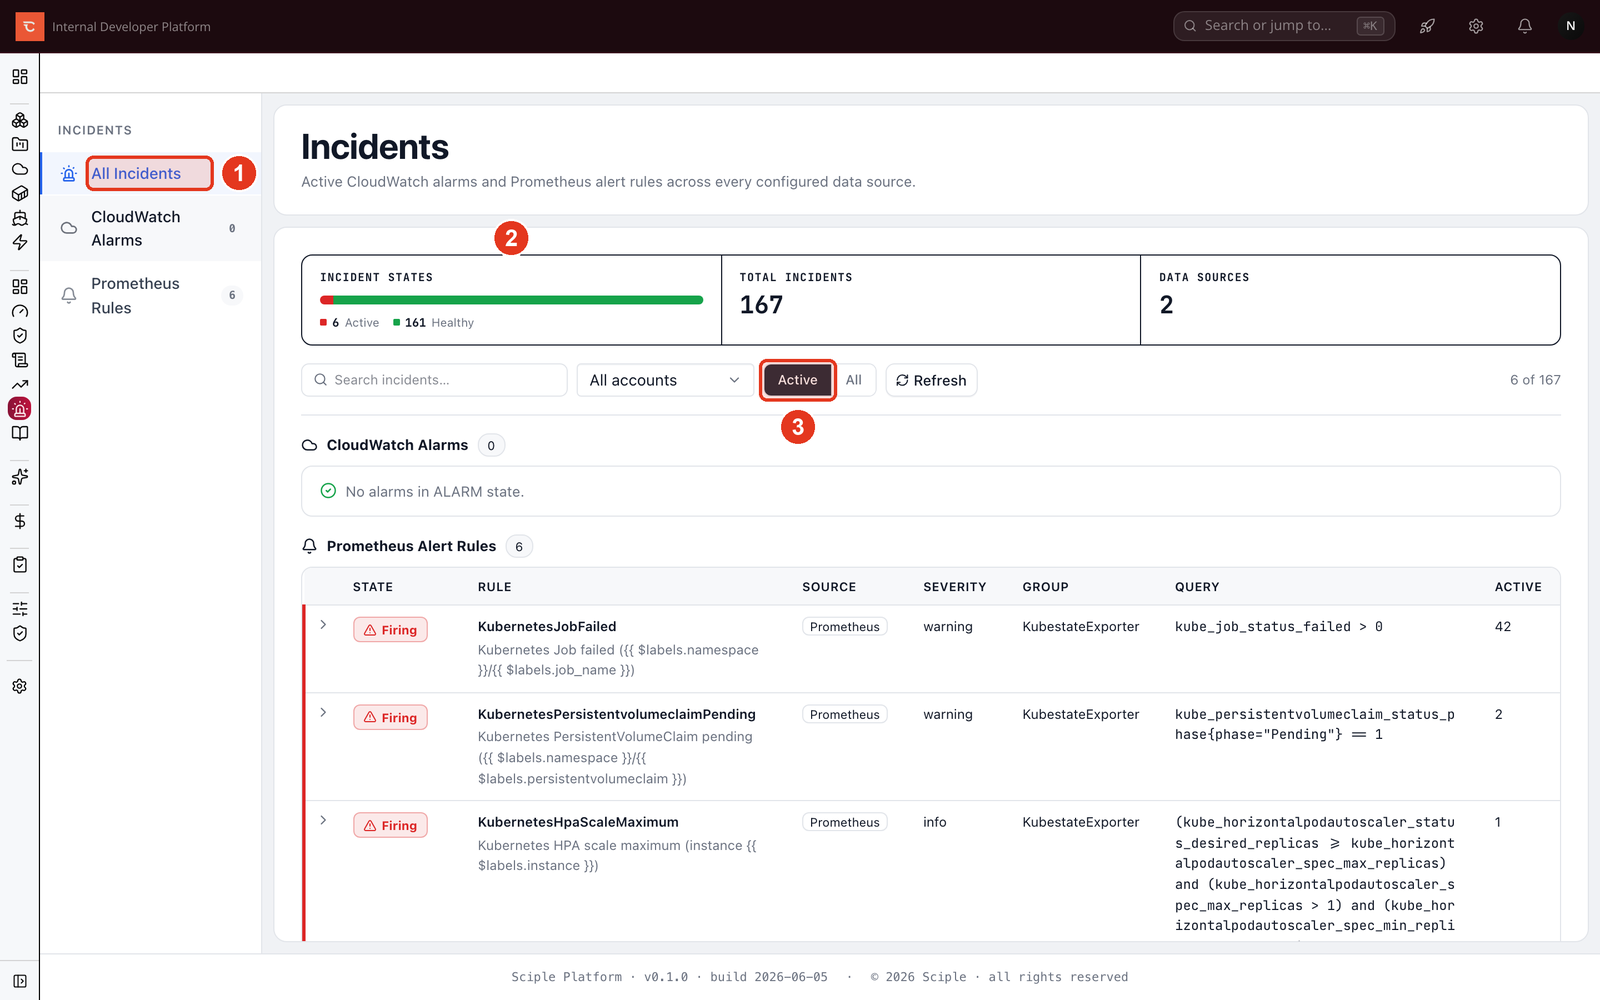
- 1 Switch between All Incidents, CloudWatch Alarms, and Prometheus Rules.
- 2 The summary cards show the state breakdown at a glance.
- 3 Filter by Active or All, and search by name, source, or reason.
CloudWatch alarms
The CloudWatch tab lists alarms from every connected AWS account. Each row shows the alarm state, the metric and condition behind it, and why it is in that state. Filter by account to narrow a noisy estate, or search to jump straight to a known alarm.
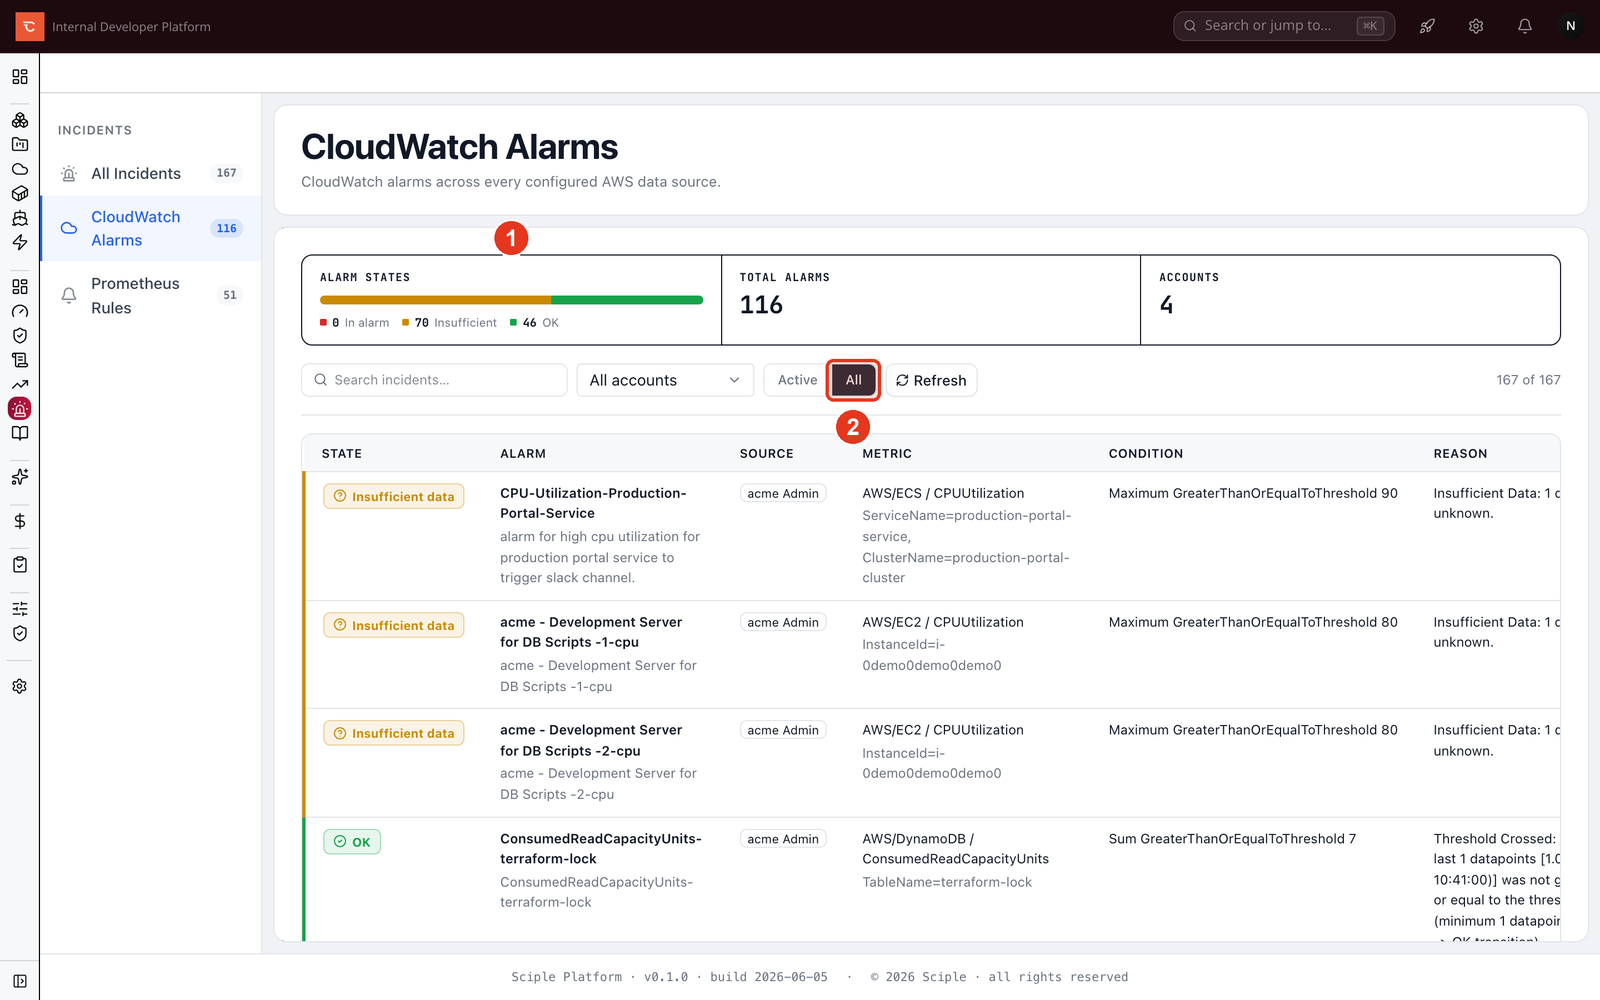
- 1 The state breakdown across in alarm, insufficient data, and OK.
- 2 Toggle All to include alarms that are currently healthy, not just those firing.
Prometheus alert rules
The Prometheus tab lists alert rules and their current state, which is either firing, pending, or inactive. Each row carries the rule’s severity, its group, the expression behind it, and a count of how many alerts are active for that rule.
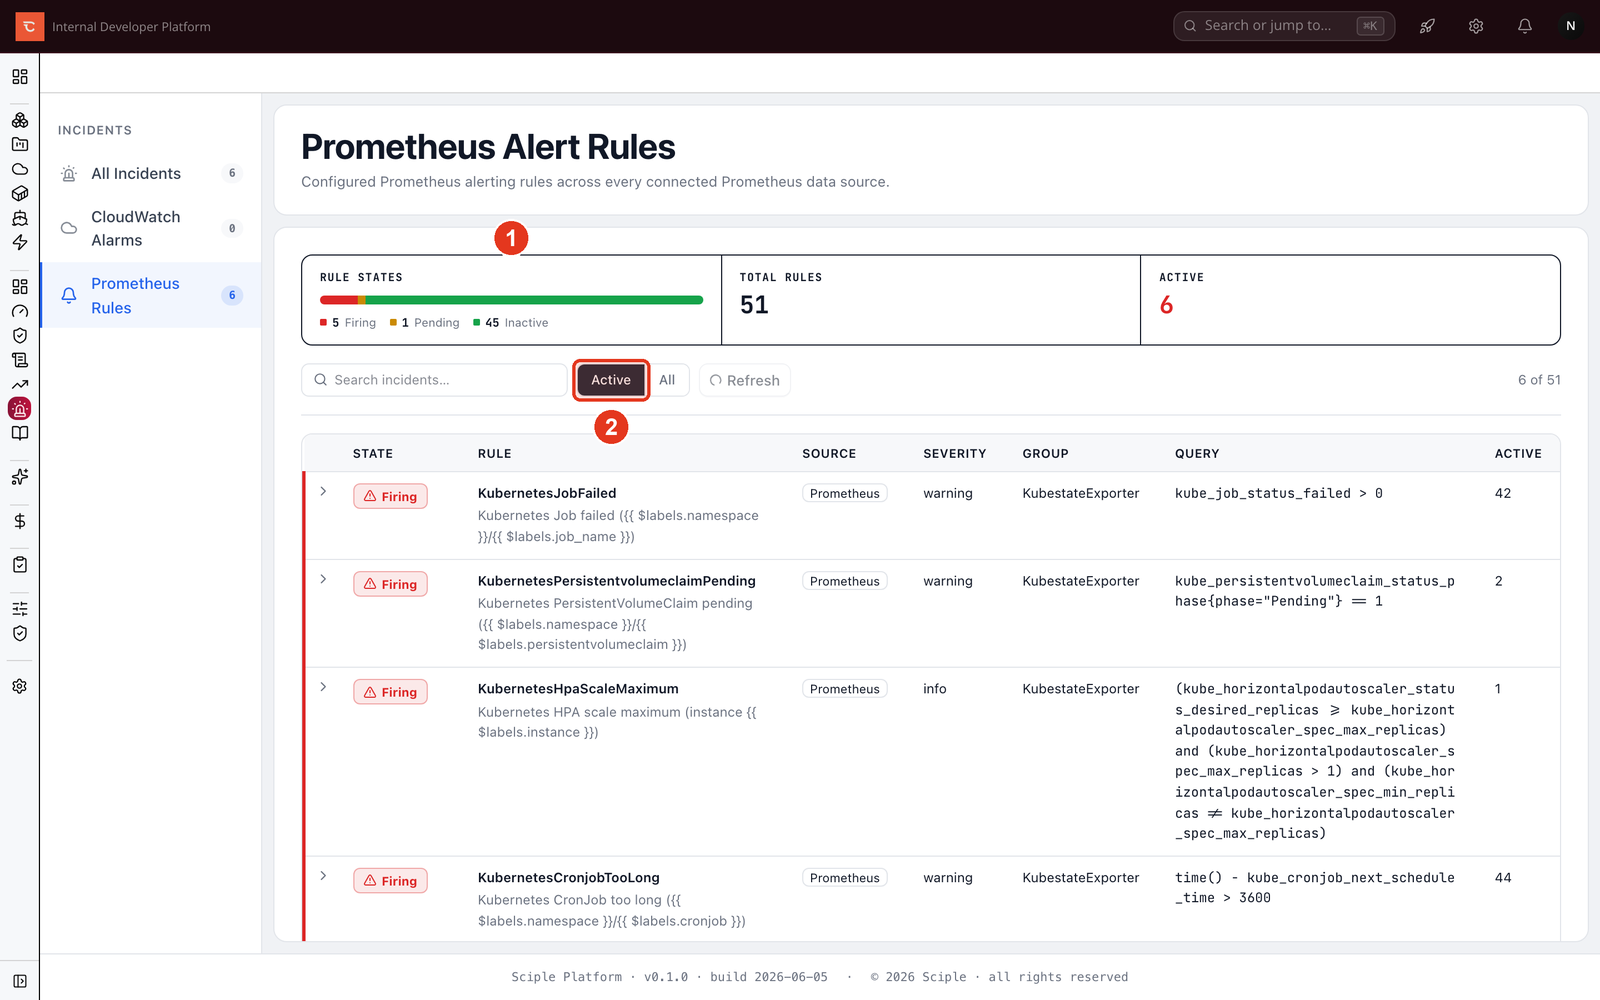
- 1 The state breakdown across firing, pending, and inactive.
- 2 Filter to Active to see only what needs attention.
Related
- Monitoring & Metrics Explorer for the data these alarms and rules watch.
- Creating dashboards to keep the relevant signals on a shared board.